
TOKYO, 26 November 2018
- UK energy data analytics startup SMAP Energy and Japanese energy retailer Looop collaborated on the creation of Japan’s first smart-meter-enabled time of use (TOU) tariff. The program was novel in that it only relied on smart-meter data and SMAP Energy’s proprietary algorithms to optimise engagement.
- 1300 Japanese energy consumers joined the TOU tariff and could receive bill savings if they shifted energy consumption off the peak times.
- TOU participants on average reduced peak time electricity consumption by 7.7%. Some groups achieved nearly 17% reduction.
- 97% of participants were able to reduce their electricity bill, with an average savings of 9%.
- SMAP AI algorithmic accuracy was proven – initially predicted 7.6% average consumption reduction in peak time electricity consumption.

Overview
Earlier this year, Japanese energy retailer Looop Inc. announced the offering of the Looop time-of-use (TOU) tariff – the first of its kind in Japan. The new product was created utilising half-hourly smart-meter data and SMAP Energy’s Smart-Meter Analytics Platform – which leverages novel artificial intelligence algorithms to extract behavioural insight.
The tariff was offered to customers in the summer period and the resulting changes in behaviour and bill savings were analysed. We look at these results in detail in this article.
What is TOU?
TOU is a form of demand-side energy management and is a way to balance the grid by incentivising energy consumers to shift habits to reduce energy consumption in peak periods.
Energy price changes with supply and demand; higher demand in the morning and evening, when people wake up and return home, raises the price significantly. However, with a single-rate tariff customers pay the same regardless of when they use energy. Ultimately, this additional cost is passed on to all customers in the form of higher rates.
If there is the capacity to measure when people actually consume their electricity – such as through the data generated from smart-meters – then there is potential to reward those who are willing to switch off the peak consumption periods with lower rates and customised energy plans. By charging different rates at different times of the day, TOU tariffs provide a direct financial incentive to consumers to change their energy habits and reduce demand peaks, allowing the savings to be passed directly to the participating consumer in the form of lower energy bills.
Recognising this opportunity, Looop sponsored the creation of a TOU tariff offer to test the potential benefit that could be delivered to customers
What role did SMAP Energy’s technology play?
SMAP Energy has provided multiple pieces of technological innovation and industry insight in facilitating the Looop TOU tariff.
First, structuring a TOU tariff is a complex challenge. TOU tariffs can vary in the number of sub-rates they offer, the time of day these rates are applied, and the size of the charge applied in the periods. Furthermore, the plan requires updating to account for behavioural and seasonal changes. Improperly designed TOU tariffs could mean that consumers work hard to shift their habits and receive no benefit or even increased bills.
Using a set of preliminary design criteria and the smart-meter data available from Looop’s customers, SMAP’s artificial intelligence (AI) algorithms identified an ideal structure to maximise bill savings for the customer while incurring no loss of profitability to Looop. Equally importantly, no demographic or personally identifiable data was used by the algorithm – eliminating the time, expense, and privacy concerns surrounding this data collection.
Second, there was no widely applicable solution for understanding how a customer’s consumption would change in response to a proposed plan or how much savings could be feasibly achieved. Once the tariff structure is decided, the typical analysis applied in previous studies would match historical energy consumption (for example, usage over the past year) to the new rates to determine how the customer’s bills would change. However, this practice can be subject to error because consumer habits are expected to change in response to the new tariff.
SMAP Energy has developed a proprietary forecasting model utilising AI techniques through parallel research at the University of Cambridge to predict this behavioural change to more accurately anticipate the effects of offering the TOU tariff to certain customers. Previous academic studies with the SMAP TOU algorithm have shown accuracy comparable to existing forecasting algorithms while relying only on the historical smart-meter data. Utilising the SMAP TOU algorithm for this project, we predicted a 7.56% reduction in peak time energy consumption.
Why is this project exciting?
When properly designed, a TOU tariff plan would incentivise the customer to switch their consumption to off-peak times, reducing the total peak demand. This is an important step for reducing grid stress and emissions, and when acting on their flexibility to shift consumption customers can receive lower energy bills as a result.
This result is especially relevant for at-risk populations, such as the elderly or those in social housing, whose limited budget makes energy bill savings relatively more valuable. Furthermore, the offering of such plans has the ability to increase competition in the marketplace, as utilities can seek to attract new customers with plans made to advantage different lifestyles or improve retention by offering plans customised to their users.
A positive result from this study would be a great step in increasing the viability and adoption of TOU tariffs across the world. TOU tariff planning – as enabled by SMAP – is also immensely scalable as it relies only on the utility’s existing data resources and communication channels. Effectively, SMAP’s solution transforms smart-meter data directly into bill savings, making a pathway for any utility to make digital offerings without additional hardware retrofits or adverse data collection requirements.
Methodology
Who are the participants?
Looop’s customer base in the Tokyo area were offered the opportunity to join the program. The participants who joined comprised of the following types of energy consumers in the “low-voltage” classification. The breakdown of participants is shown in Table 1.
|
Table 1: TOU Participant Type |
|
| Households | 440 |
| Apartments | 791 |
| Businesses | 71 |
| Total | 1302 |
Additional customer attributes were collected for post-analysis study, including number of daytime occupants and number of other residents. These attributes were not considered in the initial shifting predictions. Our previous work considered other demographic variables, such as age, gender, and socioeconomic classification; these were explicitly excluded from this study.
How does the Looop TOU program work?
The TOU program was designed around several core principles compiled from SMAP Energy’s research on the best practices of previous TOU studies.
1. Simple tariff structure
The Looop TOU tariff has two steps – a peak period and off-peak period – to make the tariff plan easy to understand. Peak time was set to be from 14:00-22:00 every day to encapsulate the standard peaks for the area. The rates are shown in Table 2, and the graphics explaining the structure to the participants is shown in Figure 1.
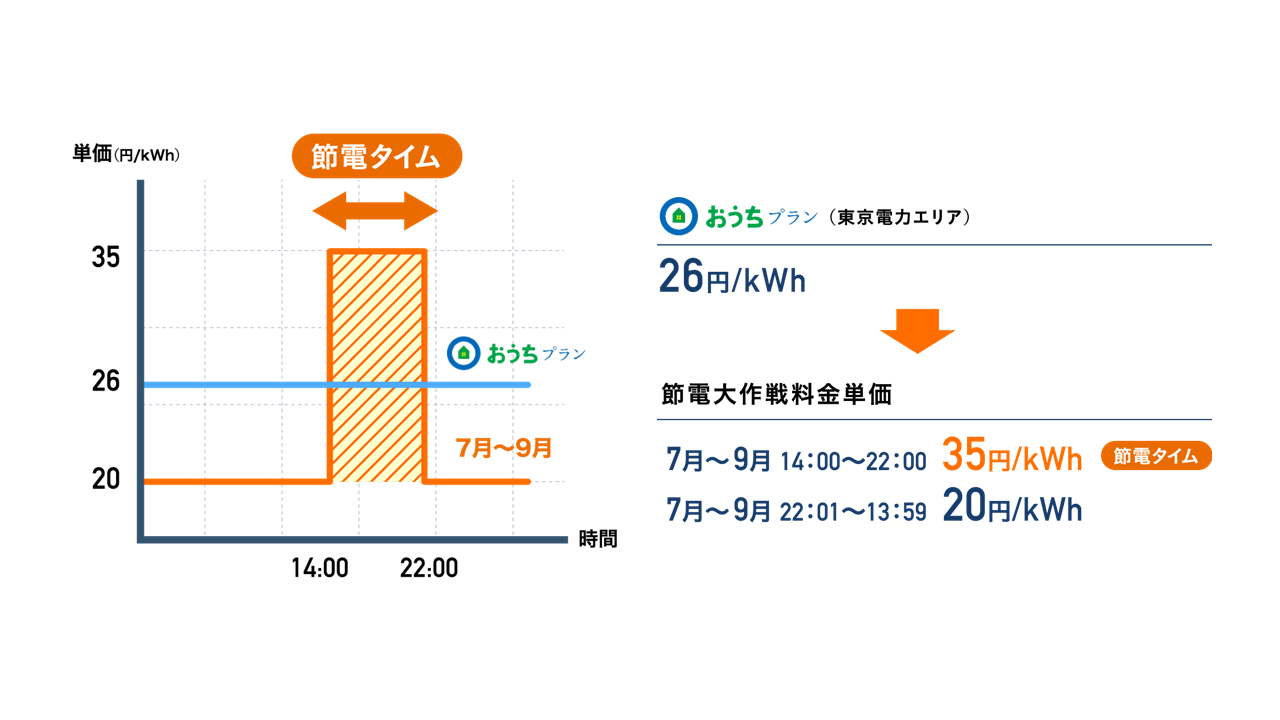 Figure 1. Graphics presented to participants explaining rate structure.
|
Table 2: TOU Tariff Rates |
|
| Flat Rate (Standard Looop tariff) | TOU Rate |
| All times – 26 JPY/kWh | 14:00-22:00 (Peak) – 35 JPY/kWh 22:00-14:00 (Off-peak) – 20 JPY/kWh |
2. Digital interactive elements
In previous engagements with Looop, SMAP Energy provided an energy consumption visualisation application that tied in to Looop’s existing customer engagement channels. For this project, this app was adapted so that participants could track both personal savings and team progress in the program. A screenshot of this is shown in Figure 2.
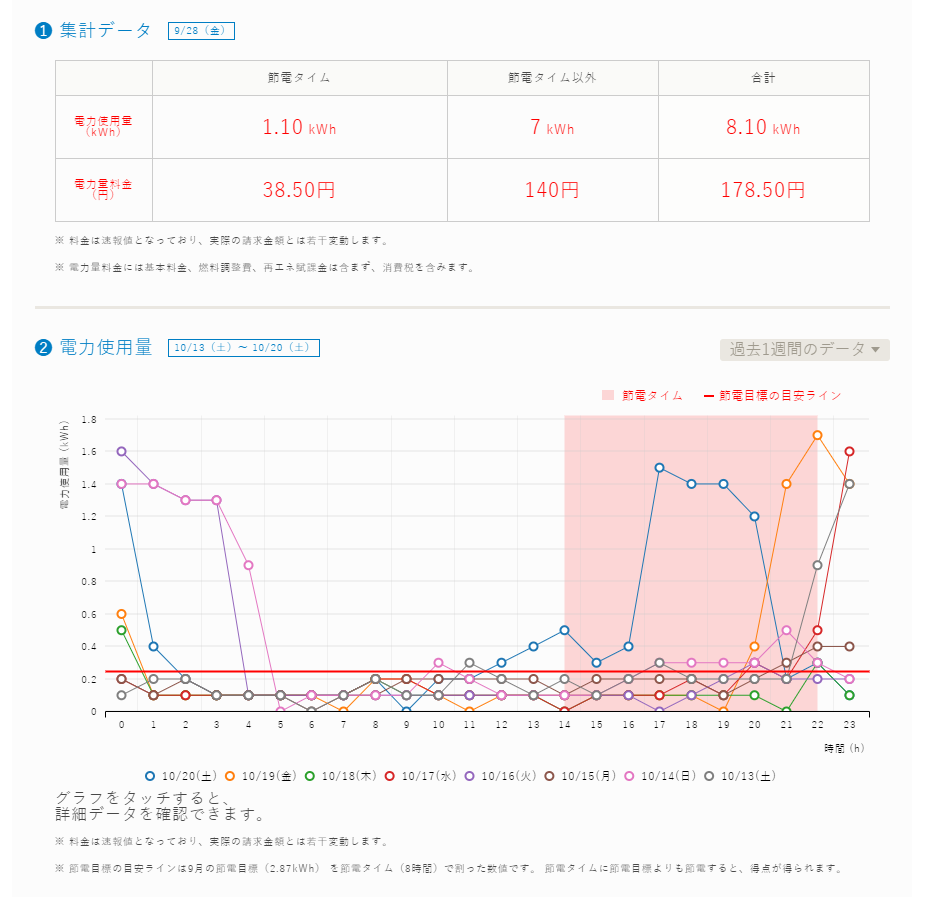 Figure 2. Energy consumption visualisation graphics shown via Looop web portal. 1 shows consumption/bill in peak period, off-peak period, and total. 2 shows consumption per hour; red area is peak; shows curves for 8 days.
3. Gamification element
Each participant was assigned to one of three teams and accrued points based on their reduction in the peak period. Engagement during the peak period was measured as a difference from a baseline estimation produced from the previous month (June 2018) of data.
Both personal and collective accumulated points were tracked with additional prizes awarded to further incentivise participation (see Table 3 and Figures 3-5). Team and individual standings were updated daily along with daily messages of encouragement from the team captains (who were internal project managers from Looop).
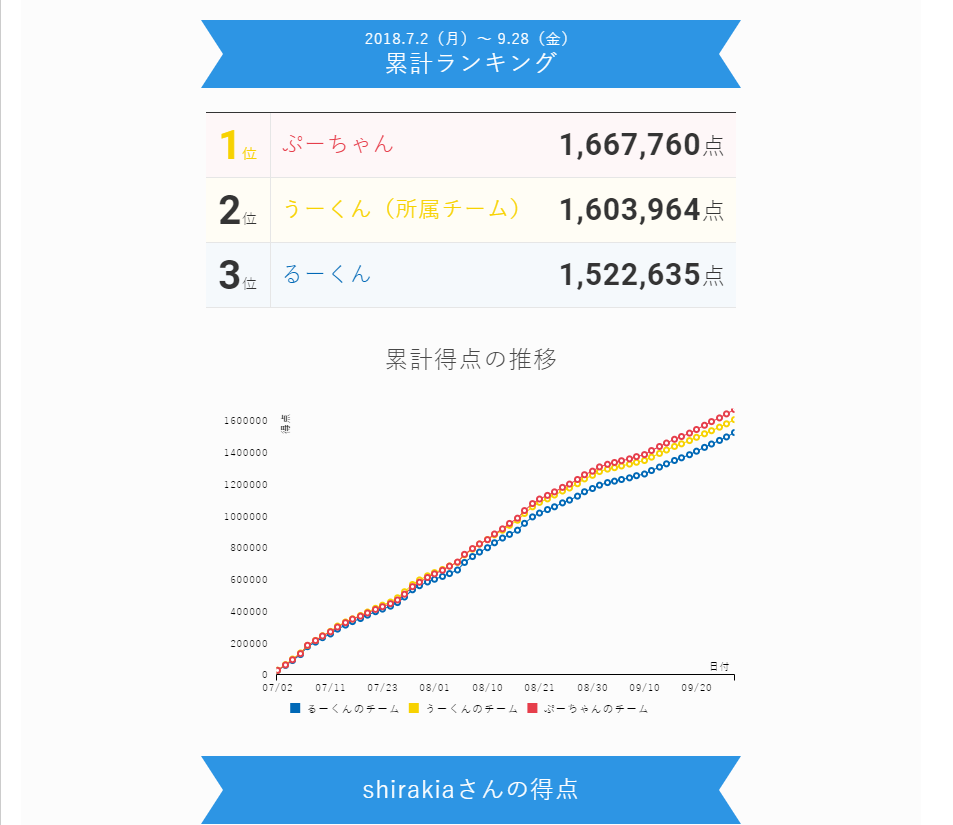 Figure 3. Points are tracked, 100 points/kWh in peak period time against personal baseline. Team point totals aggregated and updated daily.
|
Table 3: Supplementary prizes awarded during TOU campaign |
| Team prizes (awarded within winning team) |
| Top point earner – Trip to Cambridge |
| All team members – 500 JPY (~5 GBP) Amazon gift certificate |
| Overall prizes awarded to top 5 point-earners |
| 1st place – 50,000 JPY (~350 GBP) Amazon gift certificate |
| 2nd place – 40,000 JPY (~275 GBP) Amazon gift certificate |
| 3rd place – 30,000 JPY (~200 GBP) Amazon gift certificate |
| 4th place – 20,000 JPY (~135 GBP) Amazon gift certificate |
| 5th place – 10,000 JPY (~70 GBP) Amazon gift certificate |
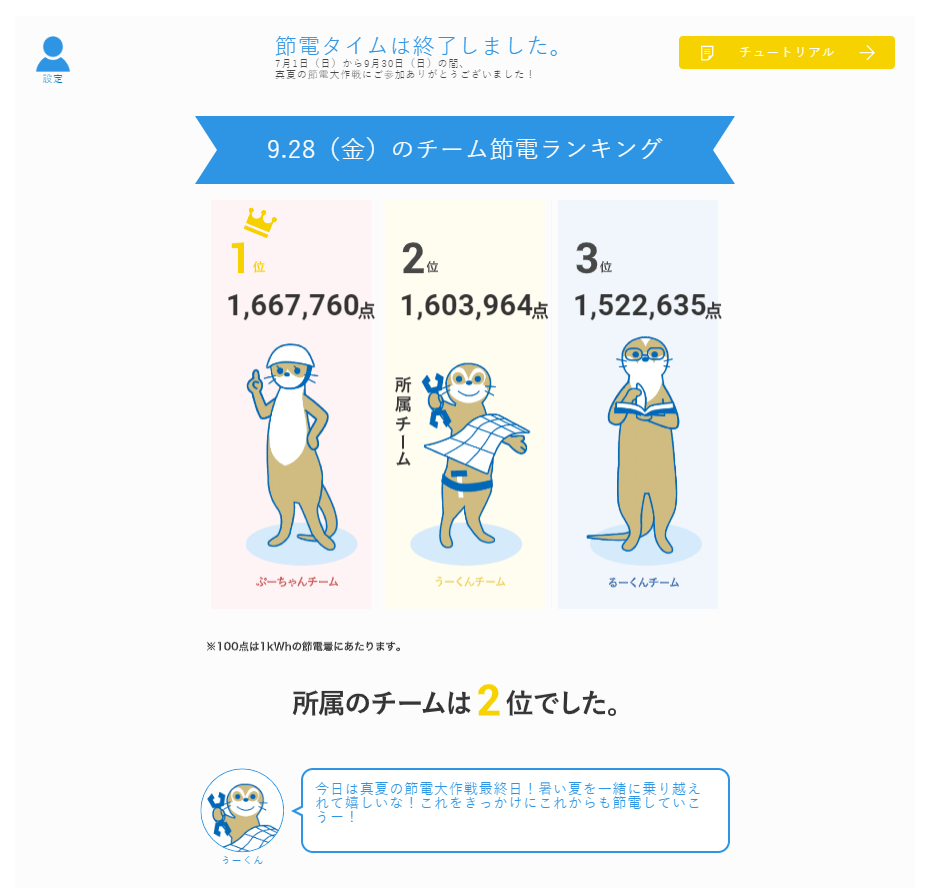 Figure 4. Daily standings for 3 teams. Personal daily encouragement from team captain (Looop manager) shown below.
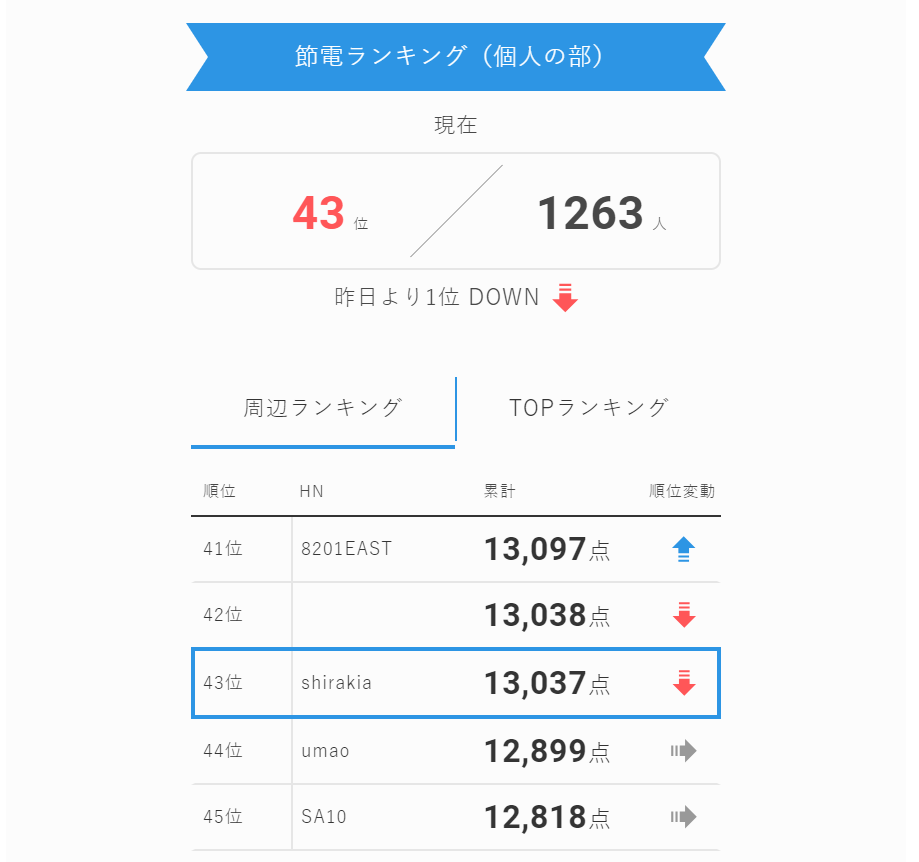 Figure 5. Personal rankings visualisation. Sample participant is ranked 43rd out of 1263. Can click to see “neighbours” of 2 spots above and below, as well as top 5 point earners overall. Recalculated per day.
4. Limited window to receive benefits
Numerous academic and industrial studies have found that engagement with the TOU plan dies off after the first few months for a significant number of consumers. To restrict this effect and simultaneously maximise the amount of savings passed to the customers, the first instance of the Looop TOU tariff was applied only from 1 July – 30 September. Participants only received the benefit during this period, incentivising them to maximise participation while reducing risk of burnout. With the entirely digital nature of this offering, the campaign could easily be repeated seasonally.
Results
To compare resulting behavioural changes, we utilised energy consumption data from Looop’s existing Tokyo customers on a flat-rate tariff to serve as a control group. The control group customers were customers who had no missing consumption readings from June 2017 to September 2018 and were randomly sampled so that the control as a whole had similar consumption over summer 2017 as the TOU participant group, as well as a similar ratio of customer type. Table 3 shows the total sizes of the comparison groups.
It should be noted that overall consumption in 2018 is generally increased from 2017; this was due to a massive heat wave that hit the area in July which recorded temperatures in excess of 40C. Thus, measuring year-on-year energy change will produce a positive increase in consumption in most cases. Therefore, a relative difference in energy change between the participant group and control group will be appropriate as a quantitative measure to consider the effectiveness of the TOU program given external factors.
We call this measure Relative Peak Reduction (RPR) Ratio. The formula for calculating RPR is shown in Figure 6.
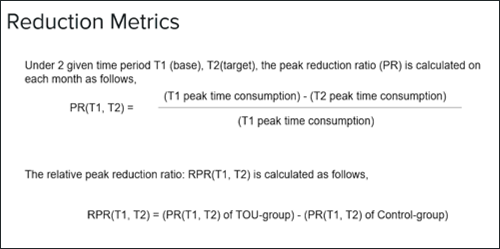 Figure 6. Formula for calculating relative peak reduction ratio in control/TOU group.
|
Table 3: Result Sample Sizes |
|
| TOU Participants | 1302 |
| Control | 1000 |
Figure 7 shows the load curves averaged overall all subjects in the participants and control groups over the course of the TOU program. From RPR calculations in Table 4, the observed average RPR during the program period months (July-September) is 7.7%. Previous studies have found results in the range of 3%-7%, so this result is exceptional. Recalling that the SMAP TOU algorithm predicted a 7.56% peak reduction, we can conclude that the SMAP TOU algorithm is accurate in its predictive capacity.
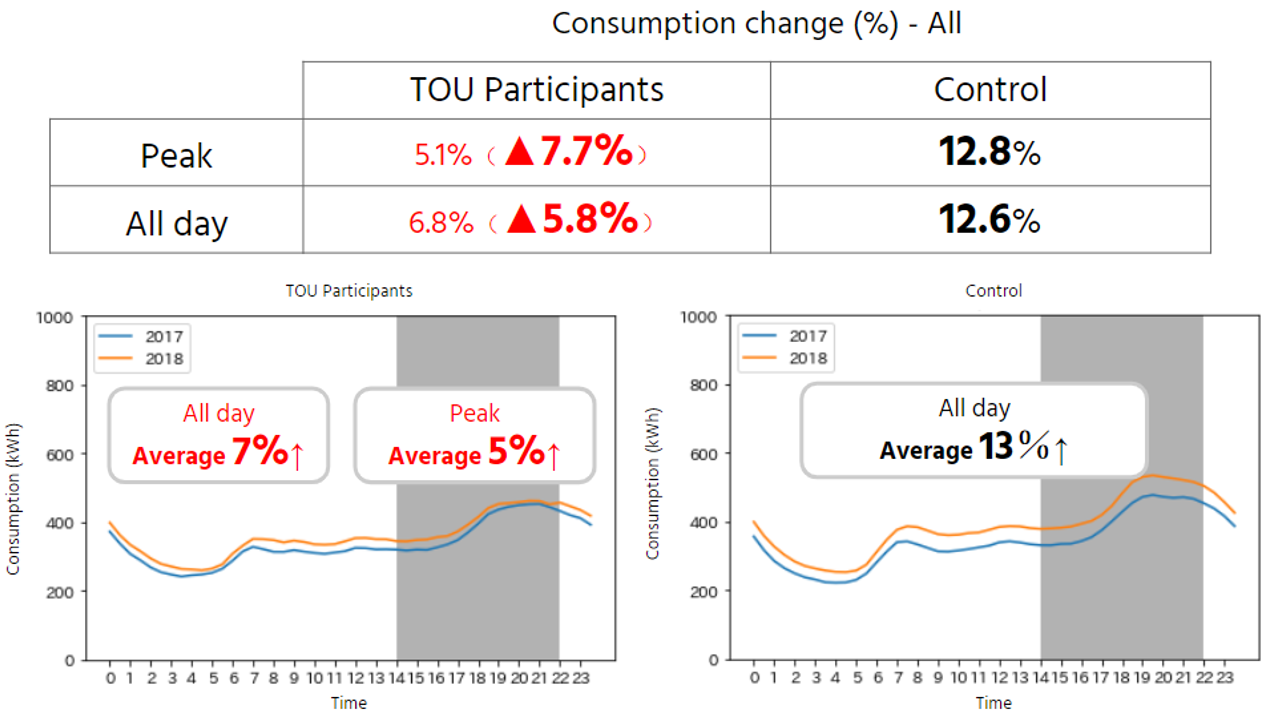 Figure 7. TOU/Control load curves for all subjects in both control and TOU groups for Summer 2017/2018; peak period shown in gray.
Figure 8 illustrates the most extreme response in energy consumption changes. Single Occupant Households in the TOU group recorded an RPR of 16.8%. The average load curve for this group also distinctly illustrates that energy consumption in the TOU cohort follows a flat or increasing trend as the end of the peak period approaches. This is evidence of postponement behaviour. We can see the energy consumer is actively putting off certain activities until the end of the period in order to receive savings, thus making the midpoint of the evening peak fall close to the end border of the peak period. In the control group, we see no such behaviour: the full shape of the peak is encapsulated in the period and consumption drops as energy-consuming activities are completed.
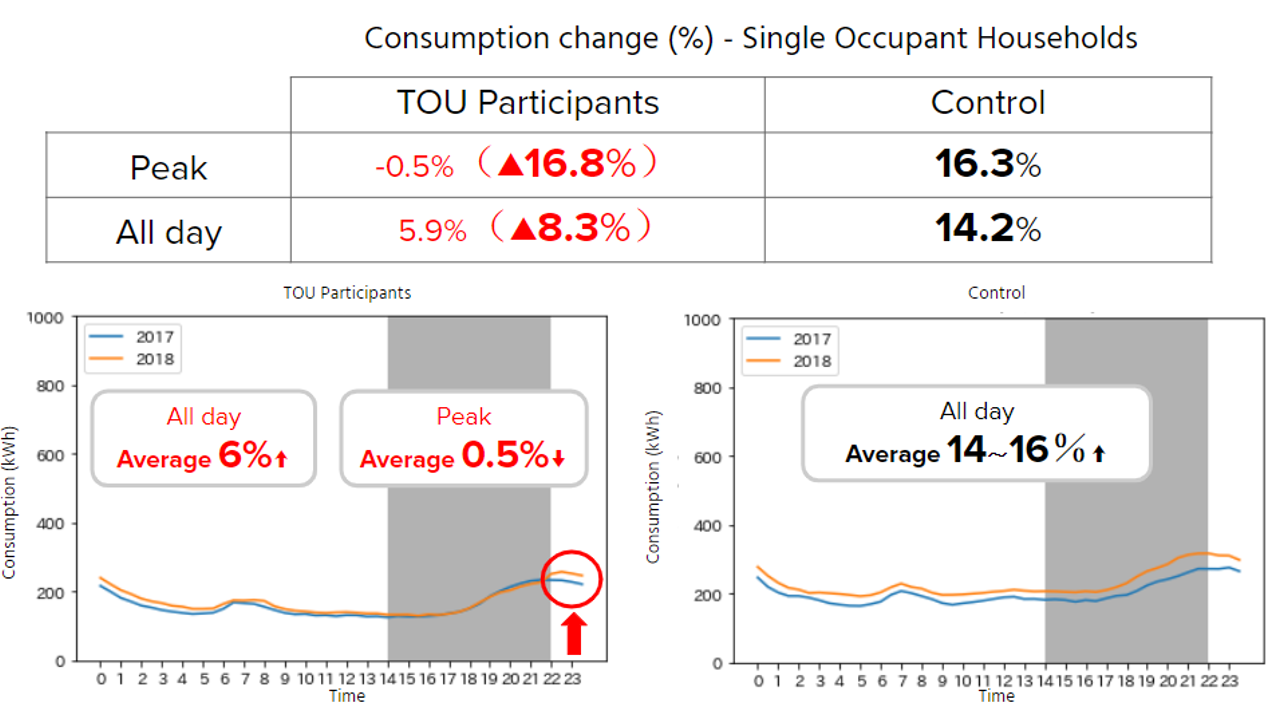 Figure 8. TOU/Control load curves for Single Occupant Household subjects in both control and TOU groups for Summer 2017/2018; peak period shown in gray.
Figure 9 illustrates the savings achieved by participants in the program. Impressively, 97% of TOU participants reduced their overall energy bill through participation in the program, and the average reduction was approximately 9%.
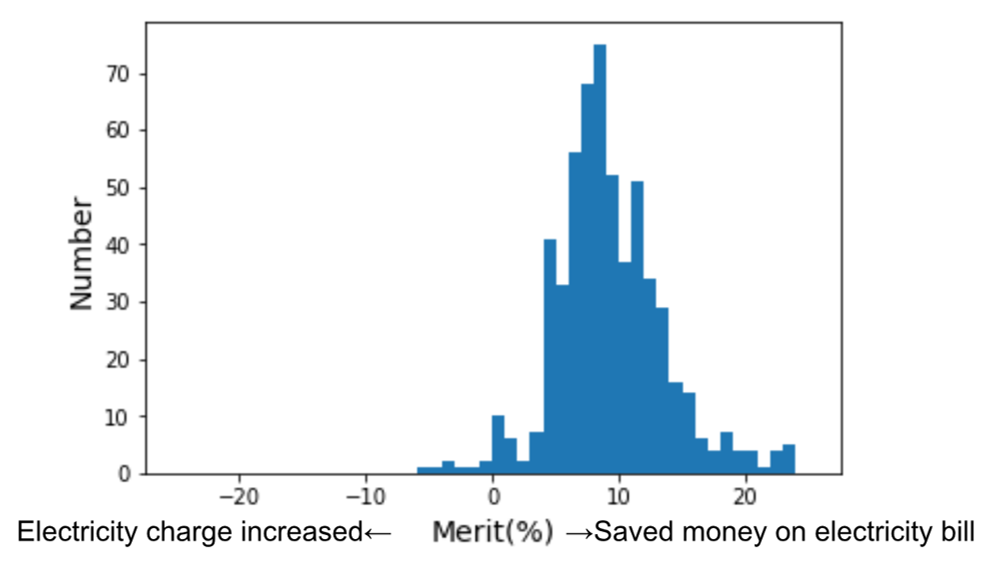 Figure 9. Overall change in electricity bill for TOU participants.
Commentary
Was it a success?
“The Looop TOU program was a remarkable success in rewarding nearly all participants with significant savings for measurable peak-time demand reduction and incurring no loss of profitability for Looop. We expect the bill savings and engagement generated by the program will have positive long-term retention effects, which we will continue monitoring in the coming months.” – Yohei Kiguchi, SMAP Energy CEO & Co-founder
“The results from this trial are significant for two reasons. Firstly, it demonstrates that energy retailers can lower their customers’ bills through incentivised behavioural change with no negative financial impact for the utility. And secondly, the model is highly adaptable and scalable as the design and analytics are based on smart meter data. If this also demonstrates improved customer loyalty or retention benefits over time, then the business case will be highly compelling.” David Trevithick, Principal Analyst, Delta-ee
What happens with the data?
“Additional information on customer segmentation and usage generated from the trial will be used to improve the design of the application and enhance customer experience further. We will anonymise and provide data generated during the trial to our academic partners at the University of Cambridge and eventually other universities and research institutions throughout the world. This is especially noteworthy for our team because as former academic researchers we often struggled to get data to inform our studies – it’s a great feeling to be able to advance the field in a meaningful way.”- Yohei Kiguchi, SMAP Energy CEO & Co-founder
What’s next?
“We will begin working to more widely commercialise the results of this study in the form of a product for energy retailers, not only in Japan but across the world. We welcome enquiries from energy retailers and other partners who would be interested in using our technology to undertake their own trial.”- Paul Monroe, SMAP Energy Co-founder
If you are an energy retailer, DSO, or other service provider who would like to partner with SMAP Energy to run a TOU trial or are interested in our services to expand your digital analytics, please contact our team at info@smapenergy.com.